How to Calculate Data Center PUE: Formula, Meter Points and a Worked Example
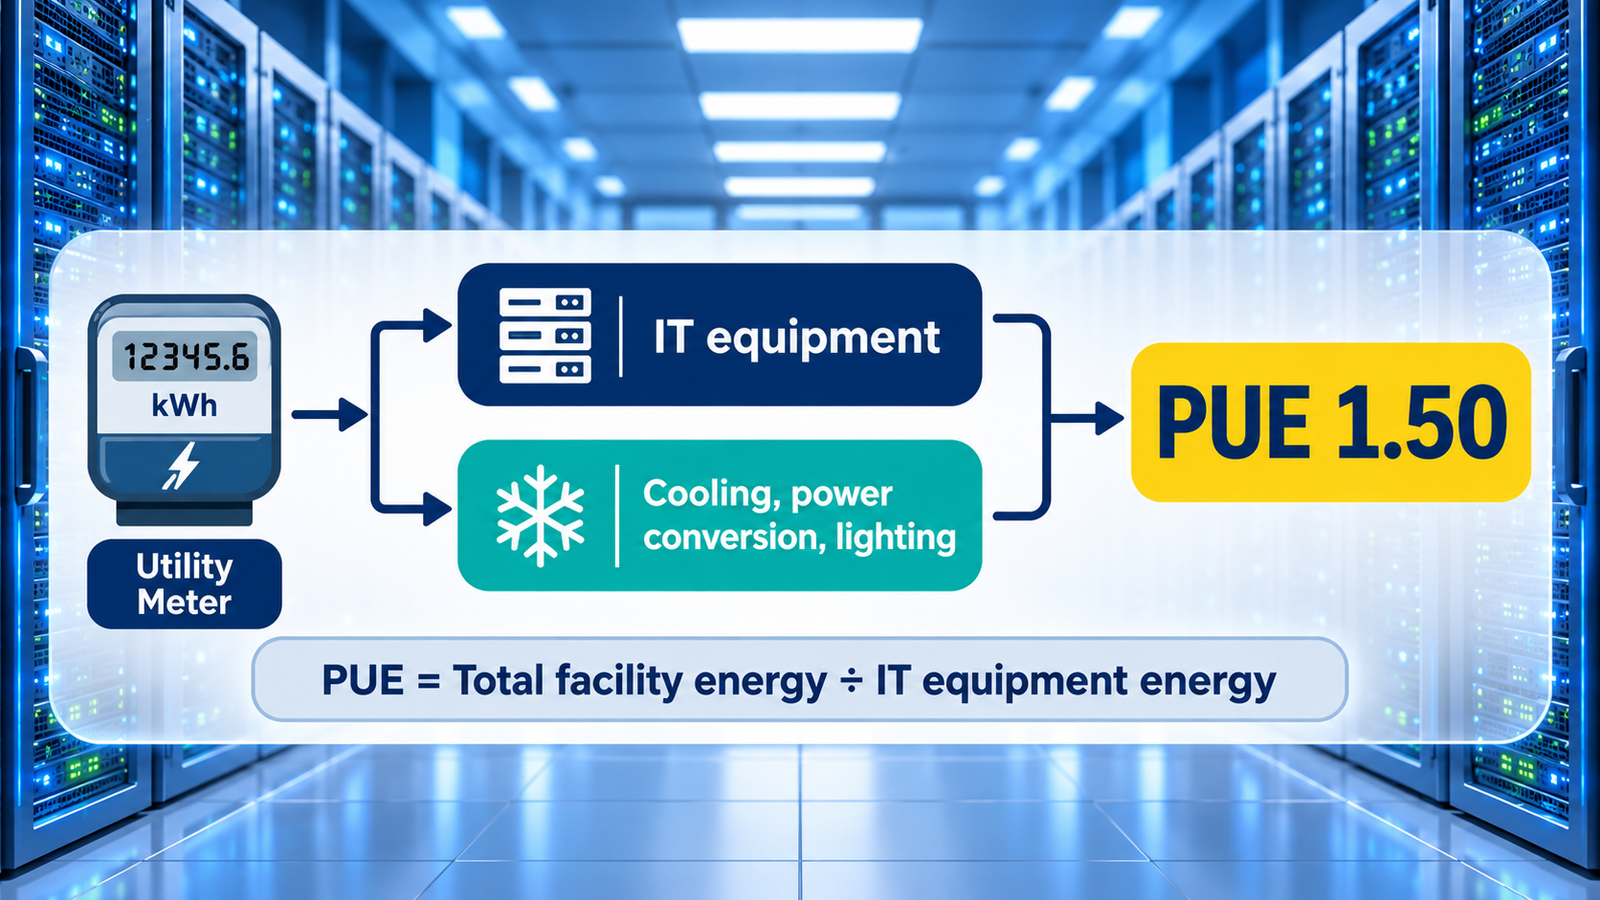
To calculate data center PUE, divide total facility energy by IT equipment energy, both measured in kilowatt-hours over the same period, ideally a full year. A PUE of 1.5 means each kilowatt-hour of computing needs another half kilowatt-hour for cooling, power conversion and lighting. The theoretical minimum is 1.0.
The arithmetic takes one line. The hard part is deciding what belongs in each number and where the meters sit, because those choices can move the result by several hundredths without anything in the building changing.
The PUE formula
The Green Grid introduced power usage effectiveness in 2007. It is now defined in ISO/IEC 30134-2, and the second edition of that standard was published in January 2026. The definition is a plain ratio:
A PUE of 1.0 would mean every kilowatt-hour entering the building reaches IT equipment. No real site gets there, because something has to remove heat, convert and distribute power, and light the rooms. Everything above 1.0 is overhead, and the number tells you how much overhead you carry per unit of useful computing.
What counts as IT equipment energy
Servers, storage and network equipment are the obvious entries. The Green Grid’s definition also includes supplementary equipment used to monitor or control the data center, such as KVM switches, monitors and workstations or laptops.
What counts as total facility energy
Total facility energy is the IT energy plus everything that supports it: power delivery, the cooling system, physical security and lighting. Because IT energy sits inside the total, PUE can’t fall below 1.0. A reading under 1.0 almost always points to a metering or boundary error.
How to calculate PUE, step by step
- Set the boundary. Decide which building or hall the number describes. In a mixed-use facility or office building, TechTarget’s guidance is to take the measurement only at the meter that powers the data center.
- Choose a measurement category. This fixes where IT energy is metered: UPS output, PDU output or the IT equipment input (see the table below).
- Pick the period. Use energy (kWh), not a power snapshot (kW), and use the same window for both figures. ISO/IEC 30134-2 treats PUE as an annualised average of energy.
- Read total facility energy. Take it from the utility meter, and include any other energy sources entering the boundary. The 2026 edition of the standard adds clearer rules for on-site generation and for energy you can’t measure directly.
- Read IT equipment energy. Use the meters at the point your chosen category specifies.
- Divide. Total facility energy over IT energy. Round to two decimals.
- Record how you got it. A PUE without its category and period is hard to interpret. Report it as, for example, “PUE2 = 1.48, twelve months to September.”
Doing this by hand once a year works for compliance. Most operators who track PUE as a working metric collect meter data automatically through power-monitoring or DCIM software, which also shows how the number moves across seasons.
A worked example
Take a facility with these annual loads, all in kilowatt-hours. The figures are illustrative, not from a real site.
| Load | Annual energy (kWh) | Counts as |
|---|---|---|
| Servers, storage, network | 1,000,000 | IT energy |
| Cooling plant and air handling | 360,000 | Overhead |
| UPS and power distribution losses | 100,000 | Overhead |
| Lighting, security, building services | 40,000 | Overhead |
| Total facility energy | 1,500,000 | IT plus overhead |
PUE = 1,500,000 ÷ 1,000,000 = 1.50. Overhead is 500,000 kWh, or 0.50 kWh for every kWh of IT load.
Data center infrastructure efficiency (DCiE) is the same relationship turned upside down: 1 ÷ PUE × 100. Here that gives 66.7%, meaning about two-thirds of incoming energy reaches IT equipment.
Why a falling PUE doesn’t always mean falling energy use
Suppose the cooling upgrade saves 100,000 kWh, so the total drops to 1,400,000 kWh and PUE improves to 1.40. Good. Now suppose instead that a server consolidation cuts IT energy by 10% to 900,000 kWh while the 500,000 kWh of overhead stays fixed. Total energy falls to 1,400,000 kWh, the same saving, but PUE rises to 1.56. The facility used less electricity and the metric got worse, because the overhead didn’t shrink with the load. PUE measures overhead per unit of IT energy. It doesn’t measure total consumption.
Where to meter IT energy: PUE categories
The standard defines categories that differ in where IT energy is read. The further downstream the meter, the closer the reading is to what the equipment actually draws.
| Category | IT energy metered at | What it means in practice |
|---|---|---|
| 1 (PUE1), basic | UPS output | Easiest to measure, least accurate. Losses in downstream distribution count as “IT”. |
| 2 (PUE2), intermediate | PDU output | Excludes PDU losses from the IT figure. Needs metered PDUs. |
| 3 (PUE3), advanced | IT equipment input | Most accurate. Excludes distribution losses from the IT figure. |
The category matters more than it looks. Using the example above, if 4% of the energy read at the UPS output is lost in PDUs and cabling before it reaches the servers (an assumed figure), a Category 1 reading counts 1,000,000 kWh as IT and reports 1.50. A Category 3 reading sees only 960,000 kWh reaching the equipment and reports 1.56. Same building, same year, different number. That’s why you should never compare a PUE1 figure with a PUE3 figure without saying so.
The Green Grid’s original scheme also had a PUE0 category based on peak power in kilowatts rather than energy. It isn’t suitable for annualised reporting, and ISO/IEC 30134-2 keeps the three energy-based categories.
What counts as a good PUE
It depends on what you compare against, and on whether the comparison is fair.
| Reference point | PUE | Note |
|---|---|---|
| Theoretical minimum | 1.0 | All energy reaches IT equipment. Not achievable in practice. |
| Google, fleet-wide trailing twelve months | 1.10 | Reported for 2024 across its large-scale data centers, in all seasons. |
| Uptime Institute industry average, 2023 | 1.58 | Survey respondents, weighted per respondent. |
| Uptime Institute industry average, 2024 | 1.56 | Largest data center of each respondent. |
| Uptime Institute industry average, 2025 | about 1.54 | Taken from secondary coverage of the survey; the full report is paywalled. |
| Level usually called inefficient | above 2.0 | One watt of overhead or more per watt of IT load. |
Two points keep these numbers in perspective. Uptime reports that average PUE has barely moved for six consecutive years, held back by older facilities and by regions where efficient cooling is harder. Its regional analysis found that 73% of reported data centers in Latin America and in the Middle East and Africa run above 1.5. Climate, facility age and size all push PUE around.
Uptime also stresses that PUE was designed to track one facility over time, not to rank different facilities against each other. The most useful benchmark is usually your own number from last year, measured the same way.
Mistakes that distort the number
- Mixing units or windows. A kW reading taken on a cool night against a kWh total for the year produces nonsense.
- Measuring only in cool months. Google says it measures continuously through the year rather than just in cooler seasons, because summer cooling load raises PUE.
- Quietly narrowing the boundary. Google notes it could report 1.06 instead of 1.10 by drawing narrower boundaries. Leave out a chiller plant or a UPS room and your PUE improves on paper only.
- Letting non-data-center loads into the meter. Offices, labs or other tenants on the same utility meter inflate the total. Separate them or use a mixed-use method.
- Reading IT load upstream of the UPS. UPS conversion losses then count as IT energy and flatter the result.
- Dropping the category. As the example showed, the metering point alone can account for several hundredths.
Mixed-use buildings and partial PUE
Not every data center has its own building, and ISO/IEC 30134-2 describes several variants for those situations.
| Variant | Use it when |
|---|---|
| mPUE (mixed-use PUE) | The data center shares a building with other functions. The 2026 edition adds guidance for this case. |
| pPUE (partial PUE) | You want the efficiency of one part, such as a modular unit or a data hall within a larger building. |
| iPUE and dPUE | Interim and designed values, described in clause 9 of the standard. |
Partial PUE is useful for managing a single system, but it has been used to publish very low figures that aren’t comparable with whole-site results. If you quote a pPUE, label it as one.
What PUE doesn’t tell you
PUE describes the building’s overhead. It says nothing about whether the IT equipment is doing useful work, so a site full of idle servers can post an excellent PUE. Uptime also points out that it doesn’t capture water use in cooling. The standard’s own interpretation guidance makes the same point: lowering PUE won’t always lower total kilowatt-hours, because the ratio ignores growth in IT demand.
Related metrics fill some of the gaps:
- DCiE: the inverse of PUE as a percentage, 1 ÷ PUE × 100.
- WUE (water usage effectiveness): how much water the site uses for cooling relative to IT energy.
- CUE (carbon usage effectiveness): total CO2 emissions from the facility’s energy use divided by IT equipment energy.
FAQs
What is the formula for data center PUE?
PUE equals total facility energy divided by IT equipment energy, both in kWh over the same period. A site that uses 1,500,000 kWh in total and 1,000,000 kWh for IT has a PUE of 1.50.
Can PUE be lower than 1.0?
Not under the standard definition, since total facility energy includes the IT energy. A value below 1.0 usually means the meters or the boundary are wrong.
Should I use kW or kWh?
Use energy in kWh for any figure you intend to report or compare. Power readings in kW give a snapshot that shifts with weather and load.
How often should I calculate PUE?
Report it annually, using a full twelve months so seasonal swings are included. If you have metering in place, tracking it continuously or monthly shows where overhead rises and helps you check whether changes worked.
What’s the difference between PUE and DCiE?
They carry the same information. DCiE is the IT share of total energy as a percentage, so a PUE of 1.5 corresponds to a DCiE of about 67%.
Does a low PUE mean the data center is efficient overall?
Not necessarily. It means the supporting infrastructure adds little overhead per unit of IT energy. It doesn’t show how productively the IT equipment is used or how much water and carbon the site consumes.
References
- ISO/IEC 30134-2:2026, Power usage effectiveness (PUE), ISO, published January 2026.
- White Paper #49, PUE: A Comprehensive Examination of the Metric, The Green Grid.
- ISO/IEC 30134-2:2018 summary: calculation, measurement points and interpretation, Rit Tech.
- PUE standards for energy efficiency, Belden.
- What is PUE (power usage effectiveness)?, TechTarget.
- Data center efficiency, Google.
- Uptime Institute Global Data Center Survey 2025, Uptime Institute.
- Mapping PUE trends by data center region, age and size, Uptime Institute Intelligence, October 2025.
- Industry average PUE of 1.58 in 2023 and PUE by facility size, Uptime Institute Journal.
- Data center: lo stato dell’arte a livello globale, Cybersecurity360 (secondary coverage of the 2025 Uptime average).
- Summary of the Uptime Institute Global Data Center Survey 2024 (average PUE 1.56).
- Google: Our PUE is lower, and it’s scrupulous, Data Center Knowledge (partial PUE context).