data center cost per MW
How Much Does It Cost to Build a Data Center in 2026? Data Center Cost per MW Explained
During the commissioning of a 40-megawatt enterprise build outside Phoenix last year, our team faced a severe supply chain squeeze when medium-voltage switchgear lead times ballooned from 52 weeks to 110 weeks. That single bottleneck threatened to add $3.2 million in holding interest and contractor standby penalties. Navigating that crisis reinforced a fundamental reality: estimating modern mission-critical facilities by square footage alone is obsolete. Today, the foundational financial benchmark across the entire sector is the data center cost per MW, a metric that reflects total mechanical, electrical, and structural capital expenditures required to support IT load.
In 2026, building a standard enterprise or colocation facility typically requires between $8 million and $12 million per megawatt of critical IT capacity. However, the explosive demand for artificial intelligence clusters and extreme rack densities has pushed advanced AI-optimized builds upwards of $15 million to $20 million+ per MW. Navigating these figures requires evaluating how electrical redundancy, cutting-edge cooling architectures, and regional labor markets drive up initial capital outlays.
Understanding Data Center Cost per MW: The Core Financial Metric
Historically, commercial real estate developers priced projects on a per-square-foot basis. In mission-critical environments, square footage tells you almost nothing about facility performance, power density, or cooling overhead. Two 100,000-square-foot shells can have radically different balance sheets if one houses legacy 8 kW enterprise racks and the other houses 80 kW high-density GPU nodes.
The data center cost per MW standardizes financial modeling across all engineering disciplines by tying total CapEx directly to delivered power capacity. This metric captures every capital expense required to deliver, condition, protect, and distribute one megawatt of usable power to the server floor. This includes front-of-meter utility interconnects, dedicated high-voltage substations, uninterruptible power supply (UPS) lineups, standby diesel generators, primary chillers, and coolant distribution units (CDUs).
CapEx Distribution Across Critical Subsystems
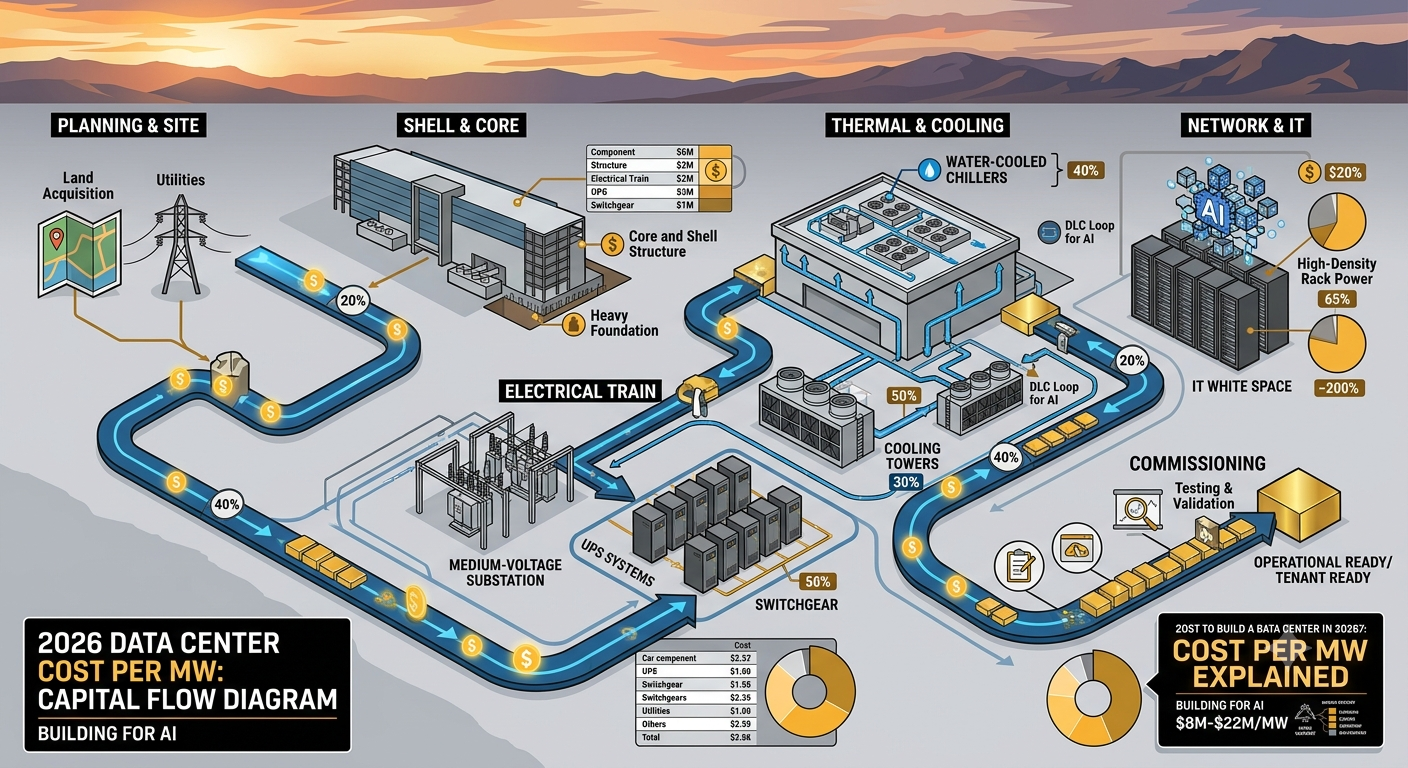
Capital deployed in a greenfield data center is heavily weighted toward mechanical, electrical, and plumbing (MEP) infrastructure. Unlike standard commercial construction where the building envelope accounts for the majority of investment, structural concrete and steel represent a modest fraction of the total facility budget.
- Electrical Power Infrastructure (40%–48% of total CapEx): Dedicated utility substations, step-down transformers, switchgear, UPS battery modules, emergency generators, and power distribution units (PDUs).
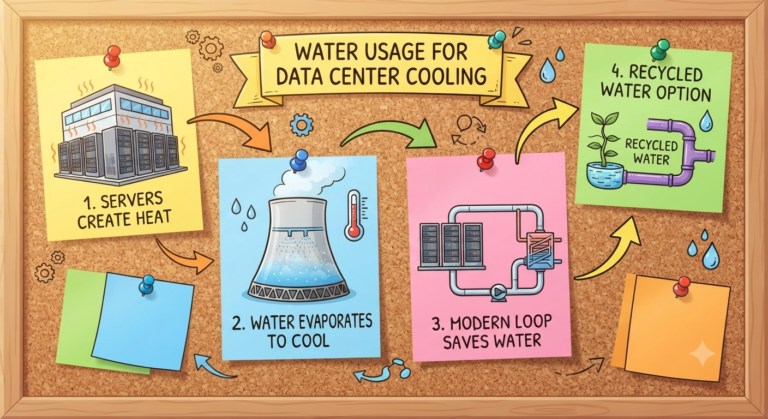
- Mechanical & Cooling Systems (18%–26% of total CapEx): Water-cooled chillers, evaporative cooling towers, direct expansion (DX) units, direct-to-chip piping loops, and CDU pumping stations.
- Structural Shell & Core (10%–15% of total CapEx): Heavy-load foundation slabs, reinforced concrete superstructures, security perimeters, loading docks, and anti-static raised flooring.
- Site Civil & Utility Interconnect (8%–12% of total CapEx): Land acquisition, environmental permits, grading, dual utility feeder trenches, and high-voltage grid interconnection agreements.
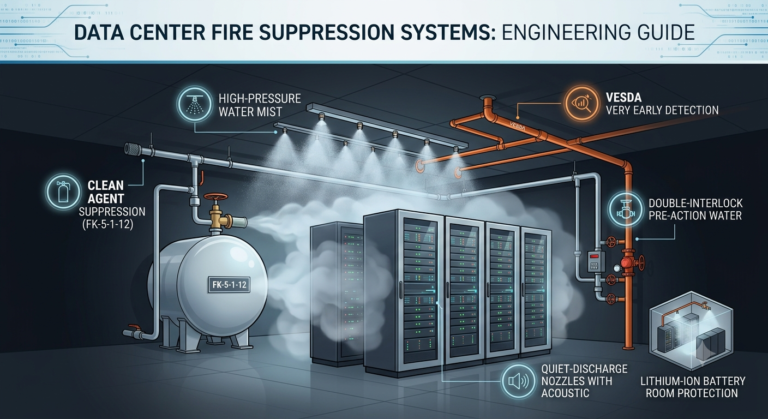
- Fire Safety, Physical Security & BMS (5%–9% of total CapEx): Clean-agent fire suppression, VESDA air sampling, biometric access controls, and Building Management System (BMS) integration.
2026 Cost Benchmarks by Data Center Tier and Architecture
The Uptime Institute Tier standard directly dictates the redundancy profile and structural resilience of a facility, which creates exponential cost tiers. Moving from a basic N+1 concurrent maintenance profile (Tier III) to a fault-tolerant 2N+1 architecture (Tier IV) requires parallel power trains, isolated physical paths, and synchronized switchboards.
| Facility Classification | Redundancy Profile | Average Cost per MW (USD) | Target Rack Density | Standard Availability SLA |
|---|---|---|---|---|
| Tier II (Basic Redundant) | N+1 Components | $7.5M – $9.5M | 5 kW – 10 kW / rack | 99.741% uptime |
| Tier III (Concurrently Maintainable) | N+1 Systems, Dual Paths | $10.0M – $12.5M | 10 kW – 25 kW / rack | 99.982% uptime |
| Tier IV (Fault Tolerant) | 2N or 2(N+1) Isolated Paths | $13.0M – $16.0M | 20 kW – 40 kW / rack | 99.995% uptime |
| AI-Optimized Hyperscale | Custom Hybrid / N+1 Liquid | $16.0M – $22.0M+ | 60 kW – 120 kW+ / rack | 99.950% – 99.990% uptime |
Tier III architectures remain the workhorse standard for enterprise colocation providers. They balance high availability with controlled capital expenditure by allowing equipment maintenance without taking critical IT white space offline.
The AI Density Shift: High-Density Power and Liquid Cooling Impact
The transition from general-purpose enterprise computing to dense artificial intelligence training clusters has rewritten traditional data center design rules. Legacy facilities were engineered for average thermal densities of 5 kW to 12 kW per rack, cooled via raised-floor cold aisle containment. Modern accelerators routinely demand 60 kW to 120 kW per cabinet, making air cooling thermodynamically unfeasible.
Implementing direct-to-chip liquid cooling loops, rear-door heat exchangers, or immersion cooling introduces substantial mechanical CapEx. Stainless steel secondary fluid networks, variable-speed pumping manifolds, and advanced filtration systems elevate the baseline mechanical spend significantly. However, these systems achieve a lower Power Usage Effectiveness (PUE) rating—often between 1.10 and 1.20—which substantially decreases lifetime operating expenditures.
| Cooling Architecture | Average Mechanical CapEx / MW | Typical Operating PUE | Supported Density per Rack | Water Consumption Footprint |
|---|---|---|---|---|
| Direct Expansion (DX) Air | $1.8M – $2.4M | 1.45 – 1.60 | Up to 12 kW | Zero direct water use |
| Chilled Water + Containment | $2.2M – $2.9M | 1.25 – 1.35 | Up to 25 kW | Moderate to High |
| Direct-to-Chip (DLC) Hybrid | $3.2M – $4.5M | 1.12 – 1.22 | 50 kW – 100 kW | Low (Closed Circuit) |
| Two-Phase / Immersion | $4.0M – $5.8M | 1.05 – 1.15 | 100 kW – 250 kW+ | Minimal |
Electrical Train Upgrades for Next-Gen Racks
High-density architectures also demand modifications to medium- and low-voltage electrical distribution trains. Traditional 208V power delivery requires thick copper busbars that consume extensive space and add massive weight. Modern engineering designs deploy 415V three-phase or direct 48V DC busway architectures directly into the rack to eliminate conversion steps and trim copper costs.
High-capacity battery energy storage systems (BESS) using Lithium Iron Phosphate (LFP) chemistries are quickly displacing lead-acid installations. While LFP batteries require higher initial capital investment, their higher energy density, longer cycle life, and smaller footprint lower white space building costs per megawatt.
Site Selection, Utility Interconnection, and Regional Variations
Geographic location plays a substantial role in total development costs. While land acquisition typically represents less than 5% of total project capital, regional utility constraints and civil permitting timelines introduce huge financial swings.
In tier-one markets such as Northern Virginia, Frankfurt, and Singapore, high-voltage utility interconnects often face multi-year queues. Building a dedicated 115 kV or 230 kV on-site substation can add between $6 million and $12 million to the upfront budget. Developers are increasingly turning to secondary and tertiary markets to secure power capacity faster, even if local labor pools require premium per diem packages.
- Tier 1 Hubs (Northern Virginia, Silicon Valley, London): High land costs ($1.5M–$3M+ per acre) and premium union labor offset by dense fiber ecosystems.
- Emerging Secondary Markets (Midwest, Texas, Nordics): Favorable power tariffs, lower real estate prices, and accelerated permitting schedules.
- Edge Deployments: Smaller 1 MW to 5 MW modular builds with higher per-unit equipment overhead ($13M–$15M/MW) due to the absence of bulk purchasing scale.
Commissioning and Operational Readiness Expenditures
Constructing the facility is only half the battle; certifying that mission-critical infrastructure operates reliably under peak load is equally essential. Commissioning (Cx) represents a structured quality assurance process carried out across five discrete phases.
- Level 1 (Factory Acceptance Testing): Inspecting and verifying individual generators, chillers, and UPS modules at the manufacturer prior to delivery.
- Level 2 (Component Verification): On-site physical inspection and static testing of installed mechanical and electrical equipment.
- Level 3 (Pre-Functional Testing): Initial energization and dry testing of isolated circuits, safety systems, and piping pressure thresholds.
- Level 4 (Functional Performance Testing): Executing live operational testing of integrated electrical switchgear and primary chiller loops under partial load.
- Level 5 (Integrated System Testing / IST): Simulating full-load utility blackouts, generator failovers, and thermal emergency dump sequences using temporary load banks.
Comprehensive Level 1 through Level 5 commissioning typically accounts for 1.5% to 3.0% of total project CapEx. Skipping thorough Level 5 validation drastically increases the risk of catastrophic downtime during tenant operation.
Frequently Asked Questions
How much does a 50 MW data center cost to build in 2026?
A standard 50 MW Tier III data center costs between $500 million and $625 million to build in 2026, assuming an average benchmark of $10 million to $12.5 million per megawatt. For AI workloads utilizing direct-to-chip liquid cooling and extreme density racks, total capital expenditure can exceed $800 million to $1 billion.
What is the biggest cost driver in data center construction?
Electrical power infrastructure is the largest cost driver, accounting for 40% to 48% of total facility CapEx. This includes utility interconnects, substations, switchgear, UPS battery arrays, standby generators, and power distribution units.
Why is cost per MW preferred over cost per square foot?
Cost per MW directly ties financial metrics to power and thermal capacity, which are the true revenue-generating limits of mission-critical facilities. Pricing per square foot fails to account for differing rack densities, Tier redundancy levels, or liquid cooling systems.
How does liquid cooling impact the initial build cost per MW?
Liquid cooling increases mechanical infrastructure capital expenditures by 30% to 50% compared to traditional air cooling. However, it reduces operational costs over time by lowering overall facility PUE and enabling rack densities of 60 kW to 120 kW+.
Optimizing Capital Efficiency in Mission-Critical Builds
Navigating the economics of mission-critical infrastructure in 2026 requires balancing initial capital investment with long-term operational resilience. Whether deploying modular enterprise colocation or scaling multi-gigawatt AI campuses, calculating your true data center cost per MW provides the transparency required to mitigate procurement delays, right-size thermal management, and protect project ROI from day one.